With Syncfusion's SfChart plugin, you can add many different types of graphics to your applications. Line Chart, Fast Line Chart, Stacked Line Chart are just a few of them. You can also customize the appearance of these graphics as you wish. SfChart plugin is what every developer needs with its useful controls.
Presenting data on graphs is a good solution to increase the user experience in the applications you develop. So you get more readable and visually beautiful views. Make sure that the end user is more satisfied with using the application. This satisfaction brings more users. Isn't that the point of a developer anyway?
At the end of this article, you will learn how to visualize data with graphs in Xamarin.Forms apps. I will use one of the best plugins, Syncfusion.Xamarin.SfChart, instead of the existing Xamarin.Forms controls. I will also implement a layered structure with the MVVM model.
Our motivation for this example project is to first get weather data from the OpenWeatherMap API and then display this data on a graph. Thus improving the user experience. So let's start.
Step 1 - Install Syncfusion.Xamarin.SfChart Plugin
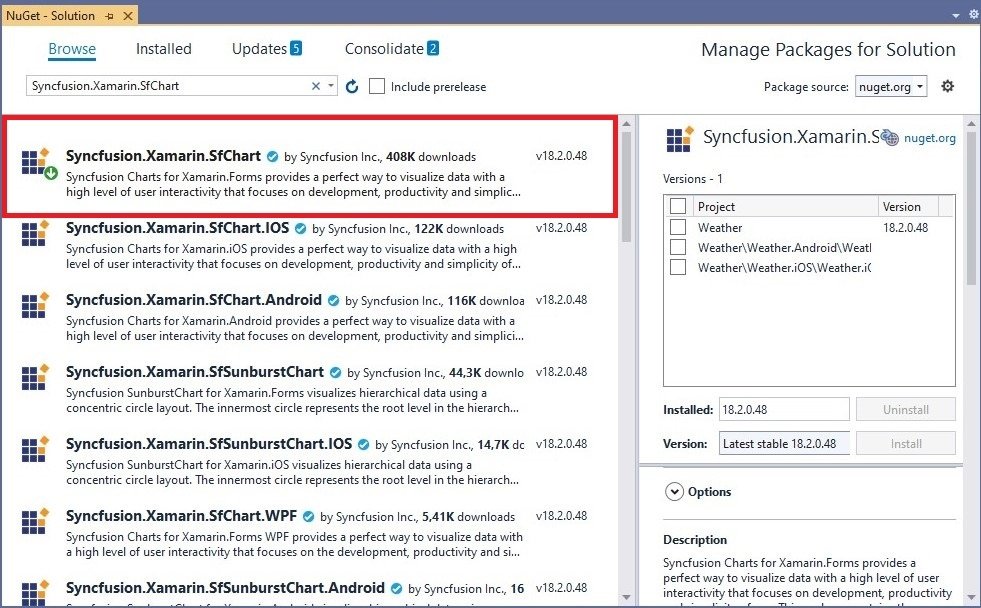
First, you need to install Syncfusion.Xamarin.SfChart plugin in your Xamarin.Forms project. There are two ways to do this. You can find details in the How To Install and Manage NuGet Packages article.
Type the following code into Package Manager Console and run it.
Install-Package Syncfusion.Xamarin.SfChart -Version 18.4.0.34Alternatively, you can install the plugin from NuGet Package Manager.
- First, right click on the project folder.
- Then click on Manage NuGet Packages for Solution option.
- Go to the Browse tab in the window that opens.
- Finally, type Syncfusion.Xamarin.SfChart in the Search bar and search. And install the plugin on all platforms.
If you use Syncfusion plugins in the project without Registration License, you will get a warning popup. To use this plugin without any warning messages, you must register with Syncfusion and obtain a Registration License. I explained how to register for Syncfusion and get License.
Let me explain briefly as follows.
- First create an account in Syncfusion.
- Then get a Registration License for Xamarin.Forms apps.
- Finally, add this license to the App() constructor method of App.xaml.cs class as follows.
public App()
{
    Syncfusion.Licensing.SyncfusionLicenseProvider.RegisterLicense("YOUR REGISTER LICENCE");
    InitializeComponent();
    MainPage = new AppShell();
}
Step 2 – Launching the Syncfusion.Xamarin.SfChart on Each Platform
To use the SfChart plugin in Xamarin, you must launch it on a platform specific. So, after installing the plugin, you cannot use it directly.
Android
The Android platform does not require any additional configuration to render the chart.
iOS
To launch the SfChart plugin on the iOS platform,
- Go to the AppDelegate.cs class.
- Then call the Init() method inside the FinishedLaunching() method. As follows. Thus, every time the AppDelegate class launch, the SfChart plugin will also initialize.
{
    …
    global::Xamarin.Forms.Forms.Init();

    Syncfusion.SfChart.XForms.iOS.Renderers.SfChartRenderer.Init();

    LoadApplication(new App());
    …
}
Step 3 - Populating Data for SfChart
In this step, I will apply the MVVM model to the sample project and get the data from the OpenWeatherMap API and put it in a List.
Model Class
You need a model class to get weather data. I followed this path to fully implement the MVVM architecture. Click the handle to the project and create a new folder named Models and create the FiveDayThreeHours.cs class inside this folder.
    public class Main
    {
        public double temp { get; set; }
        public double feels_like { get; set; }
        public double temp_min { get; set; }
        public double temp_max { get; set; }
        public int pressure { get; set; }
        public int sea_level { get; set; }
        public int grnd_level { get; set; }
        public int humidity { get; set; }
        public double temp_kf { get; set; }
    }
    public class Weather
    {
        public int id { get; set; }
        public string main { get; set; }
        public string description { get; set; }
        public string icon { get; set; }
    }
    public class Clouds
    {
        public int all { get; set; }
    }
    public class Wind
    {
        public double speed { get; set; }
        public int deg { get; set; }
    }
    public class Sys
    {
        public string pod { get; set; }
    }
    public class List
    {
        public int dt { get; set; }
        public Main main { get; set; }
        public IList<Weather> weather { get; set; }
        public Clouds clouds { get; set; }
        public Wind wind { get; set; }
        public int visibility { get; set; }
        public double pop { get; set; }
        public Sys sys { get; set; }
        public string dt_txt { get; set; }
    }
    public class Coord
    {
        public double lat { get; set; }
        public double lon { get; set; }
    }
    public class City
    {
        public int id { get; set; }
        public string name { get; set; }
        public Coord coord { get; set; }
        public string country { get; set; }
        public int population { get; set; }
        public int timezone { get; set; }
        public int sunrise { get; set; }
        public int sunset { get; set; }
    }
    public class FiveDayThreeHours
    {
        public string cod { get; set; }
        public int message { get; set; }
        public int cnt { get; set; }
        public IList<List> list { get; set; }
        public City city { get; set; }
    }
Weather Services
In my Using Weather API in Xamarin article, I explained how to get the data from the API. I will not touch this issue again here.
Right click on the project and create a folder named Services and create the WeatherAPI.cs class within this folder.
    class WeatherAPI
    {
        public const string OPENWEATHERMAP_API_KEY = "YOUR API KEY HERE";
        public const string BASE_URL = "https://api.openweathermap.org/data/2.5/forecast?q={0}&appid={1}&units=metric";
        public static async Task<FiveDayThreeHours> GetFiveDaysAsync(string query)
        {
            FiveDayThreeHours weather = new FiveDayThreeHours();
            string url = String.Format(BASE_URL, query, OPENWEATHERMAP_API_KEY);
            HttpClient httpClient = new HttpClient();
            var response = await httpClient.GetAsync(url);
            if (response.IsSuccessStatusCode)
            {
                var content = await response.Content.ReadAsStringAsync();
                var posts = JsonConvert.DeserializeObject<FiveDayThreeHours>(content);
                weather = posts;
            }
            return weather;
        }
    }
Now that we have the data, we have to process them in the ViewModel class.
ViewModel Class
Right click on the project and create a folder named ViewModels and a class WeatherViewModel.cs inside that folder.
Let's take the weather data of Istanbul from the service and try to show the first 7 of these data on the Chart. Here I used the IList and List data structures. With the for loop, we put the temperature and the felt temperature into the List.
    public class WeatherViewModel : INotifyPropertyChanged
    {
        private IList<FiveDayThreeHours> _weatherList;
        public IList<FiveDayThreeHours> WeatherList
        {
            get
            {
                if (_weatherList == null)
                    _weatherList = new ObservableCollection<FiveDayThreeHours>();
                return _weatherList;
            }
            set
            {
                _weatherList = value;
                OnPropertyChanged();
            }
        }
        public event PropertyChangedEventHandler PropertyChanged;
        private List<Main> weekList { get; set; }
        public List<Main> WeekList
        {
            get
            {
                return weekList;
            }

            set
            {
                if (value != weekList)
                {
                    weekList = value;
                    OnPropertyChanged();
                }
            }
        }
        protected virtual void OnPropertyChanged([CallerMemberName] string propertyName = null)
        {
            PropertyChanged?.Invoke(this, new PropertyChangedEventArgs(propertyName));
        }
        public WeatherViewModel()
        {
            Task.Run(SelectedCityAsync);
        }
        private async Task SelectedCityAsync()
        {
            var weather = await WeatherAPI.GetFiveDaysAsync("Istanbul");
            WeatherList.Add(weather);

            List<Main> week = new List<Main>();
            for (int i = 0; i < 5; i++)
            {
                week.Add(new Main
                {
                    temp = weather.list[i].main.temp,
                    feels_like = weather.list[i].main.feels_like
                });
            }
            WeekList = week;
        }
    }
SfChart View
Right click on the project and create a folder named Views and a class WeatherPage.xaml inside that folder.
<ContentPage.BindingContext>
<local:WeatherViewModel></local:WeatherViewModel>
</ContentPage.BindingContext>
<ScrollView>
<StackLayout>
<StackLayout>
<pancakeview:PancakeView Grid.Row="1" BackgroundColor="#f9f9f9" HeightRequest="400" WidthRequest="400" CornerRadius="20" HasShadow="True">
<chart:SfChart x:Name="Chart" HorizontalOptions="Fill" VerticalOptions="Fill">
<chart:SfChart.Legend>
<chart:ChartLegend />
</chart:SfChart.Legend>
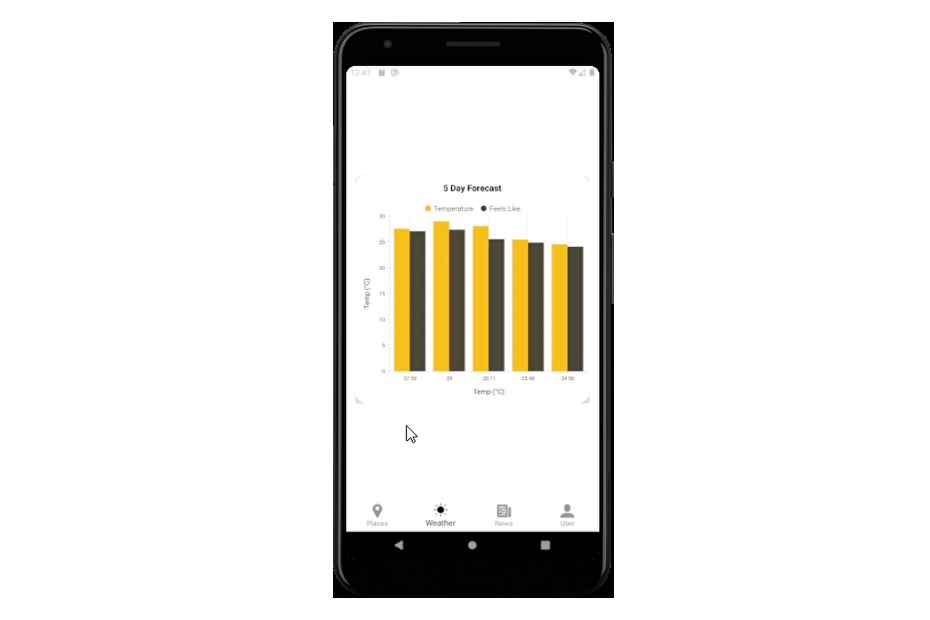
<chart:SfChart.Title>
<chart:ChartTitle Text="5 Day Forecast" FontAttributes="Bold" FontSize="15"/>
</chart:SfChart.Title>
<chart:SfChart.PrimaryAxis>
<chart:CategoryAxis>
<chart:CategoryAxis.Title>
<chart:ChartAxisTitle Text="Temp (°C)"/>
</chart:CategoryAxis.Title>
</chart:CategoryAxis>
</chart:SfChart.PrimaryAxis>
<chart:SfChart.SecondaryAxis>
<chart:NumericalAxis>
<chart:NumericalAxis.Title>
<chart:ChartAxisTitle Text="Temp (°C)"/>
</chart:NumericalAxis.Title>
</chart:NumericalAxis>
</chart:SfChart.SecondaryAxis>
<chart:SfChart.Series>
<chart:ColumnSeries ItemsSource="{Binding WeekList}" Label="Temperature" XBindingPath="temp" YBindingPath="temp" EnableTooltip="True">
</chart:ColumnSeries>
<chart:ColumnSeries ItemsSource="{Binding WeekList}" Label="Feels Like" XBindingPath="temp" YBindingPath="feels_like" EnableTooltip="True">
</chart:ColumnSeries>
</chart:SfChart.Series>
</chart:SfChart>
</pancakeview:PancakeView>
</StackLayout>
</ScrollView>Don't forget to add the required namespaces after pasting the codes.
Conclusion
Everything is ok. You can now run the application and see how it looks.